
The Metrics
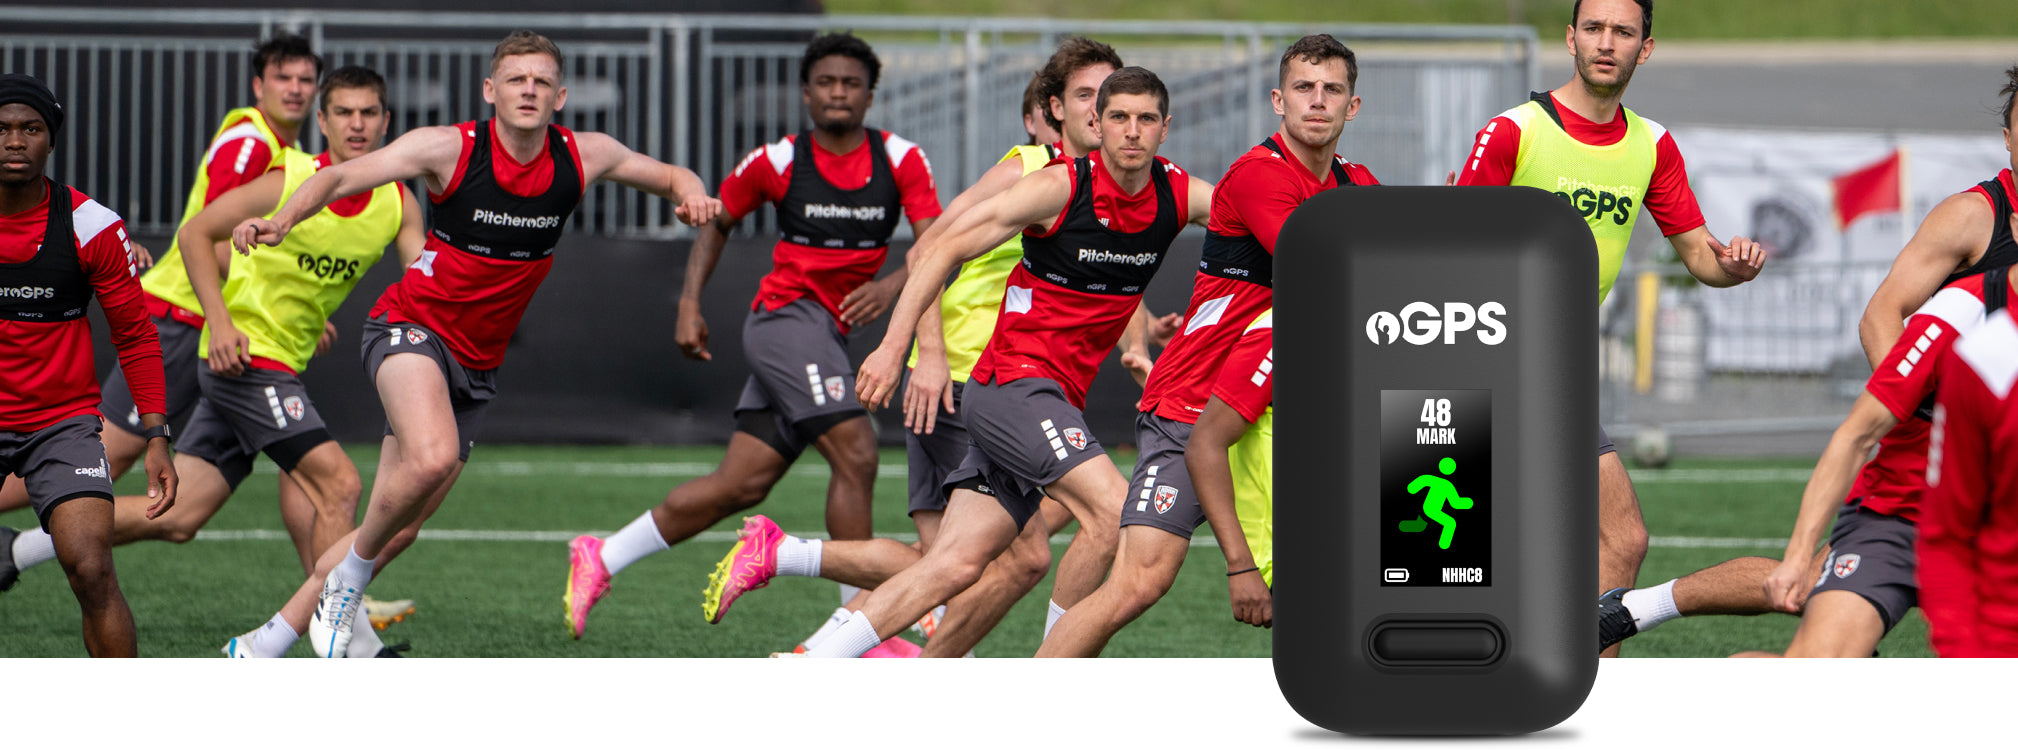
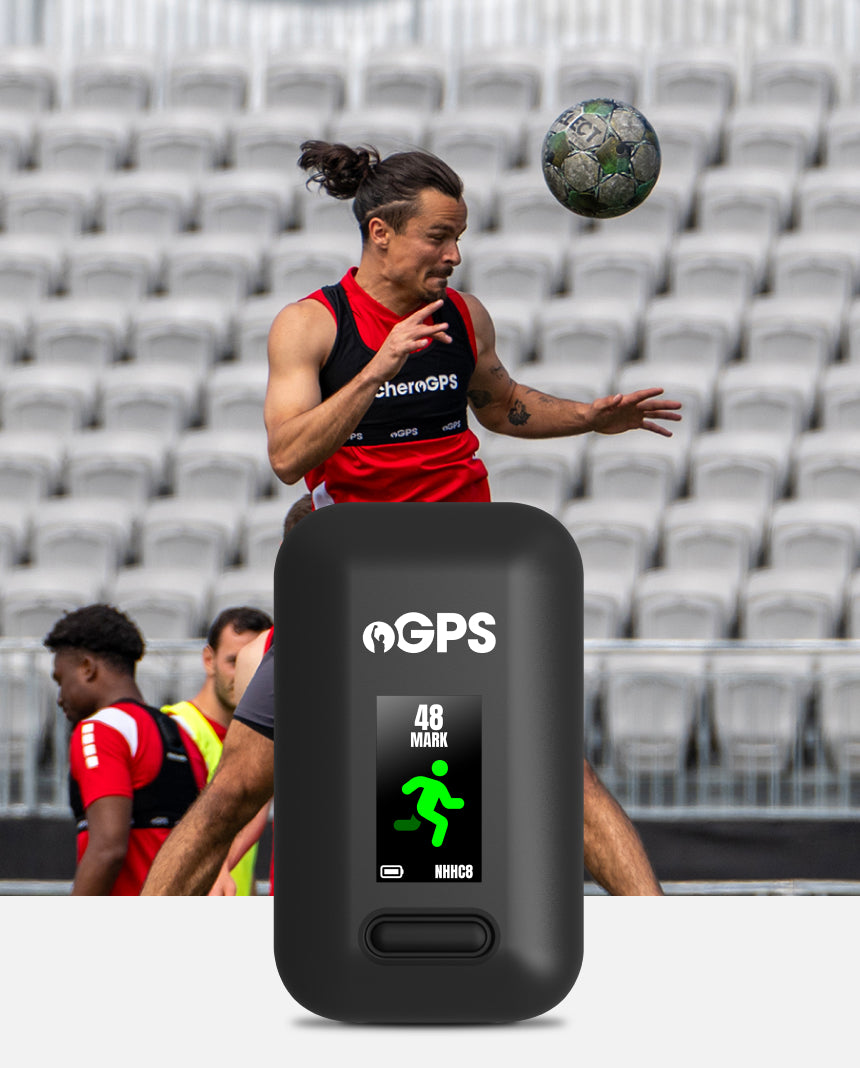
SPEED
Know how fast your really are.
Track your maximum speed, high-speed running and time spent in different speed zones. Compare training with match performance and see how your speed changes over time.
Max Speed
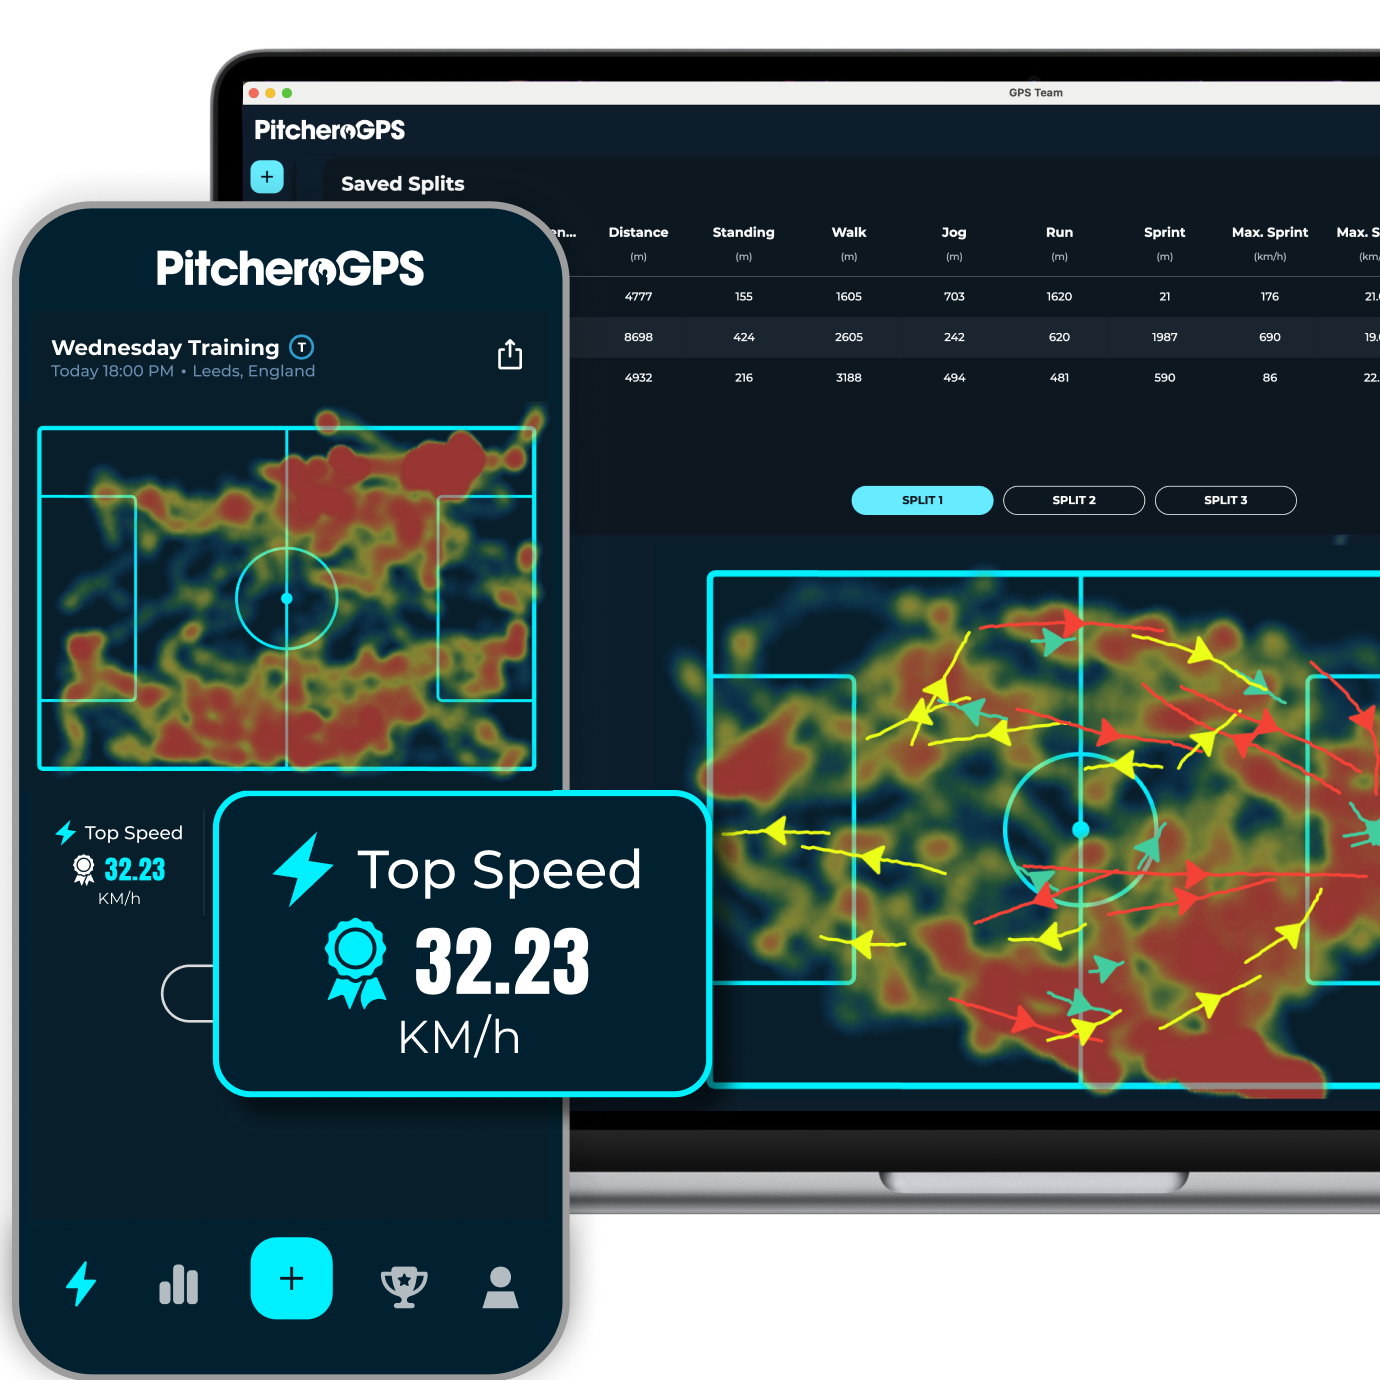
- See the fastest speed you reach during every training session and match.
- PitcheroGPS records your maximum sustained speed.
- Compare Max Speed between sessions and matches.
- Track personal bests and see how your speed develops over time.
High-Speed Runs (HSR)
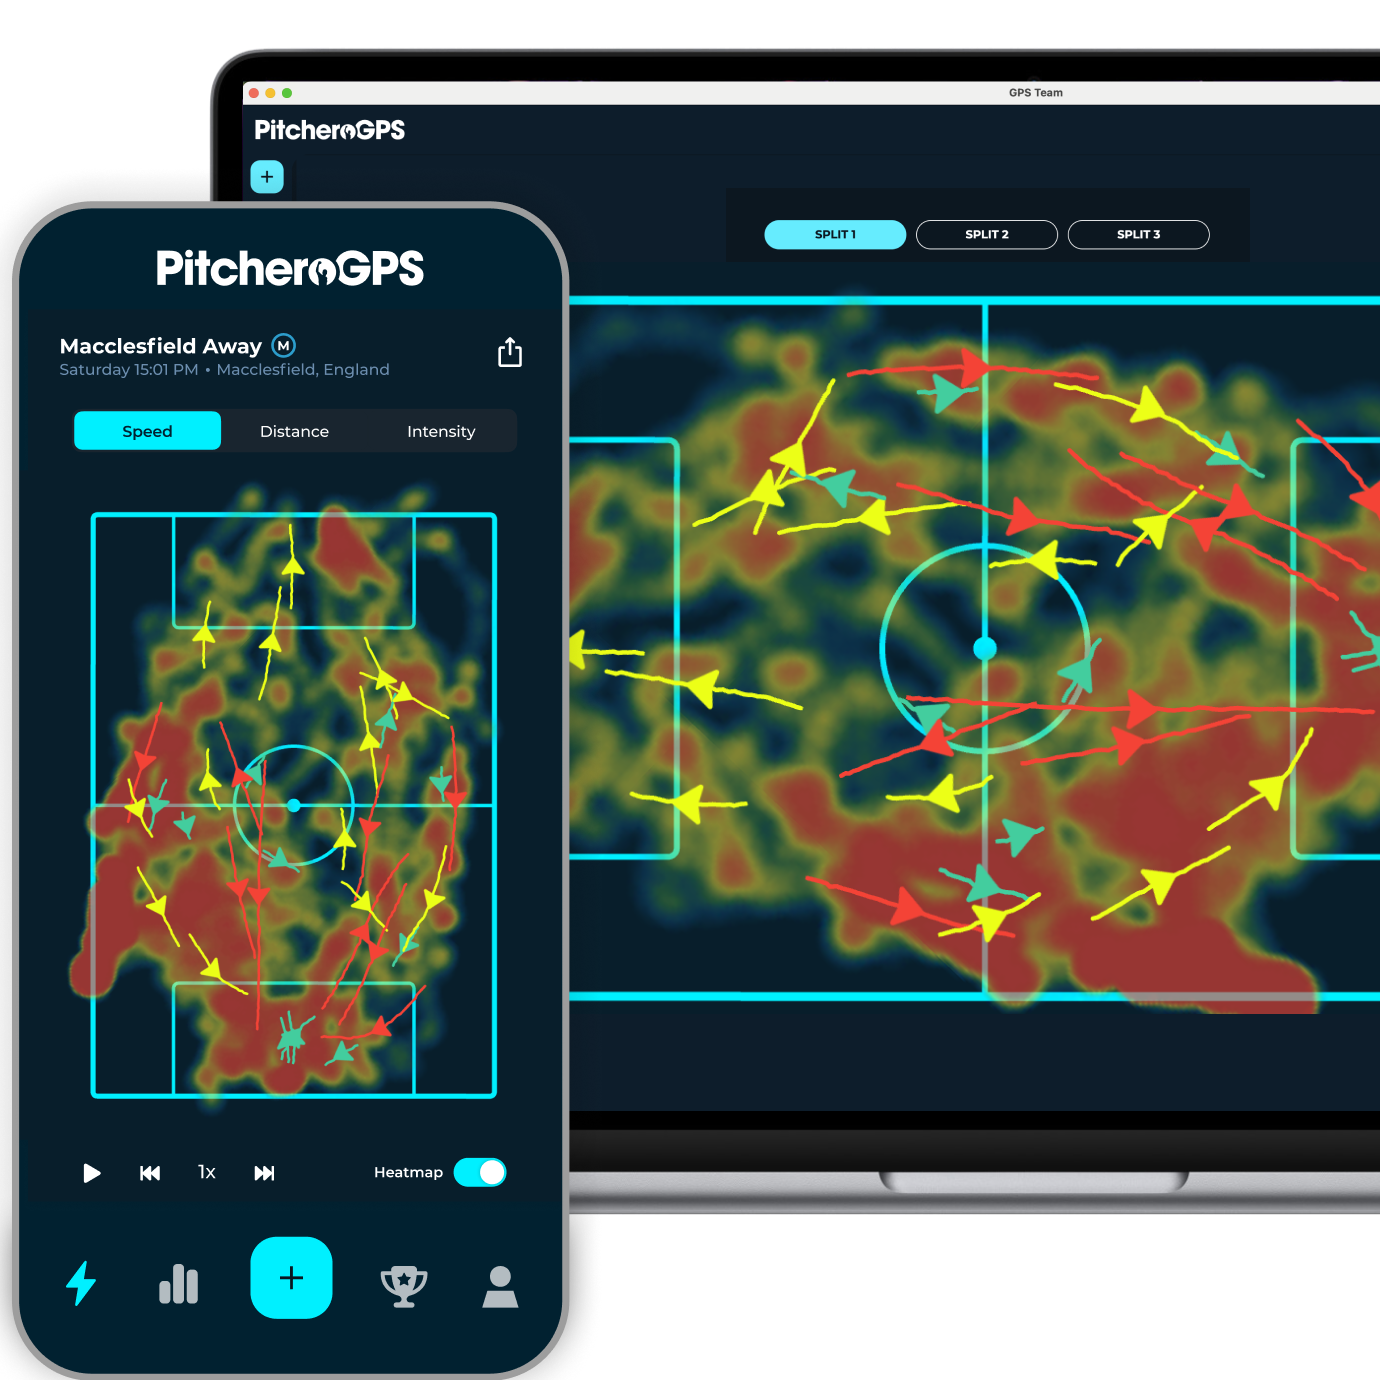
- See how often you perform at high speed — and how much distance you cover there.
- Track the number of high-speed runs in every session.
- Measure total distance covered above your chosen speed threshold.
- Customise the threshold to suit your sport, level or individual performance.
- Compare high-speed output between training and matches.
Speed Zones
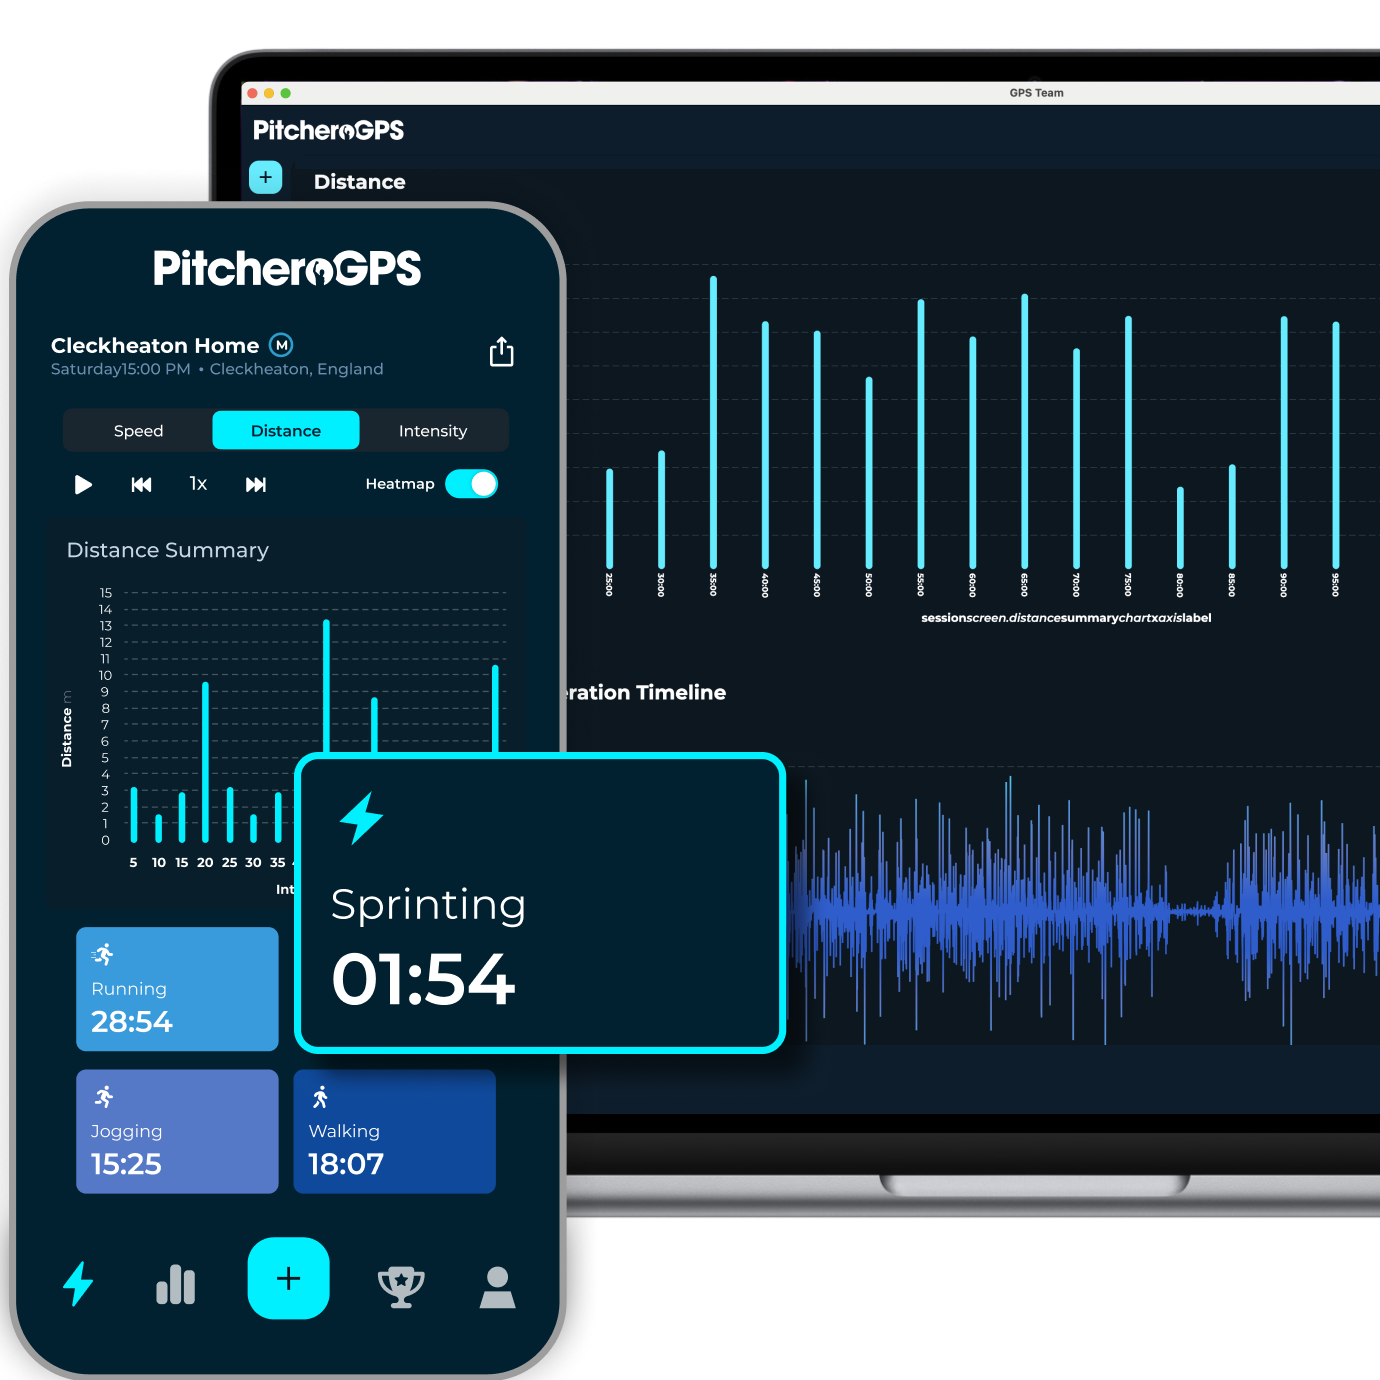
- See where your session intensity comes from.
- PitcheroGPS breaks your movement into customisable speed zones such as walking, jogging, running and sprinting.
- See how much time and distance you spend in each zone.
- Compare the intensity of different sessions.
- Understand how training output compares with competition.
Distance
Understand your total workload.
See how much ground you cover and how your work rate changes throughout a session. Distance metrics help turn an overall session into something you can measure and compare.
Total Distance
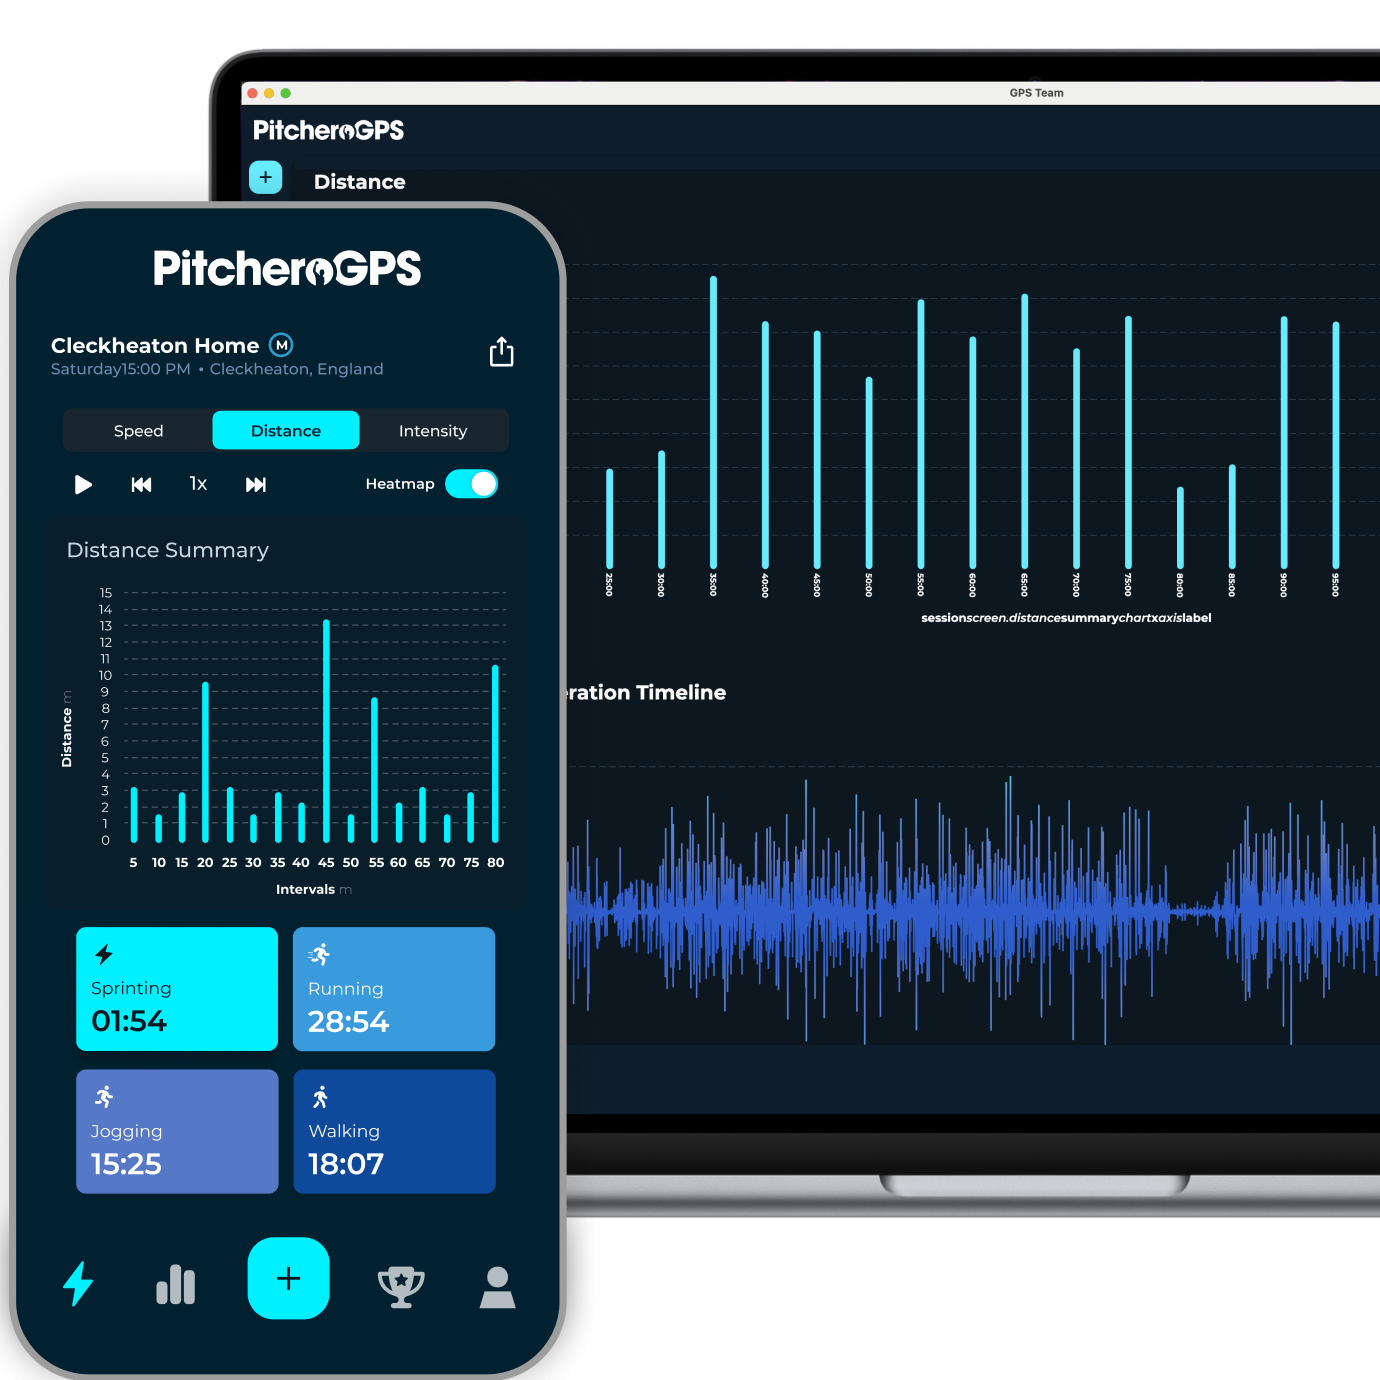
- Know exactly how much ground you covered.
- Track total distance in every session and match.
- Compare output between sessions.
- Compare individual players within a team.
- Build a clearer picture of physical demands over time.
Work Rate — Metres Per Minute
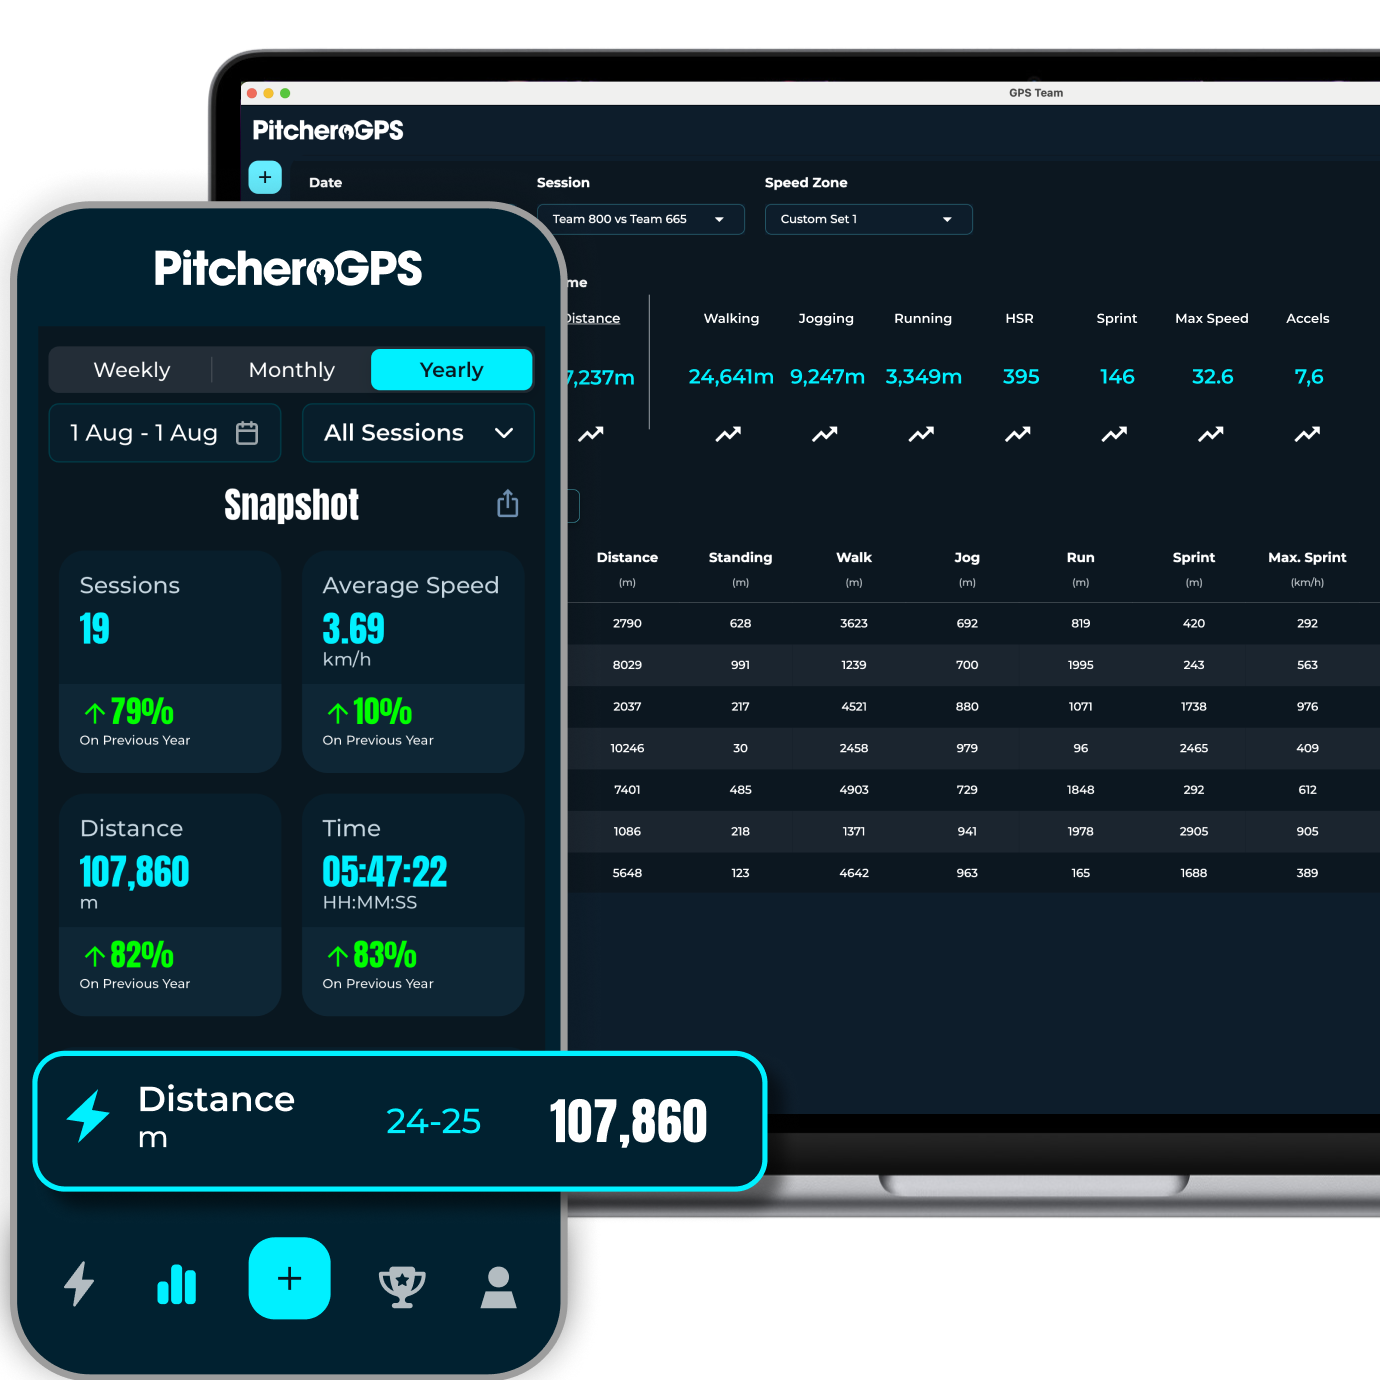
- See how hard you worked, regardless of how long you were on the pitch.
- Track metres covered per minute.
- Compare work rate across sessions of different lengths.
- See how intensity changes throughout a match or training session.
- Compare different periods of the same session.
Intensity
Measure the Explosive Parts of Performance.
Football, rugby and hockey aren't played at one constant speed. PitcheroGPS captures accelerations and decelerations to show the high-intensity movements behind your overall distance.
Accelerations/Decelerations
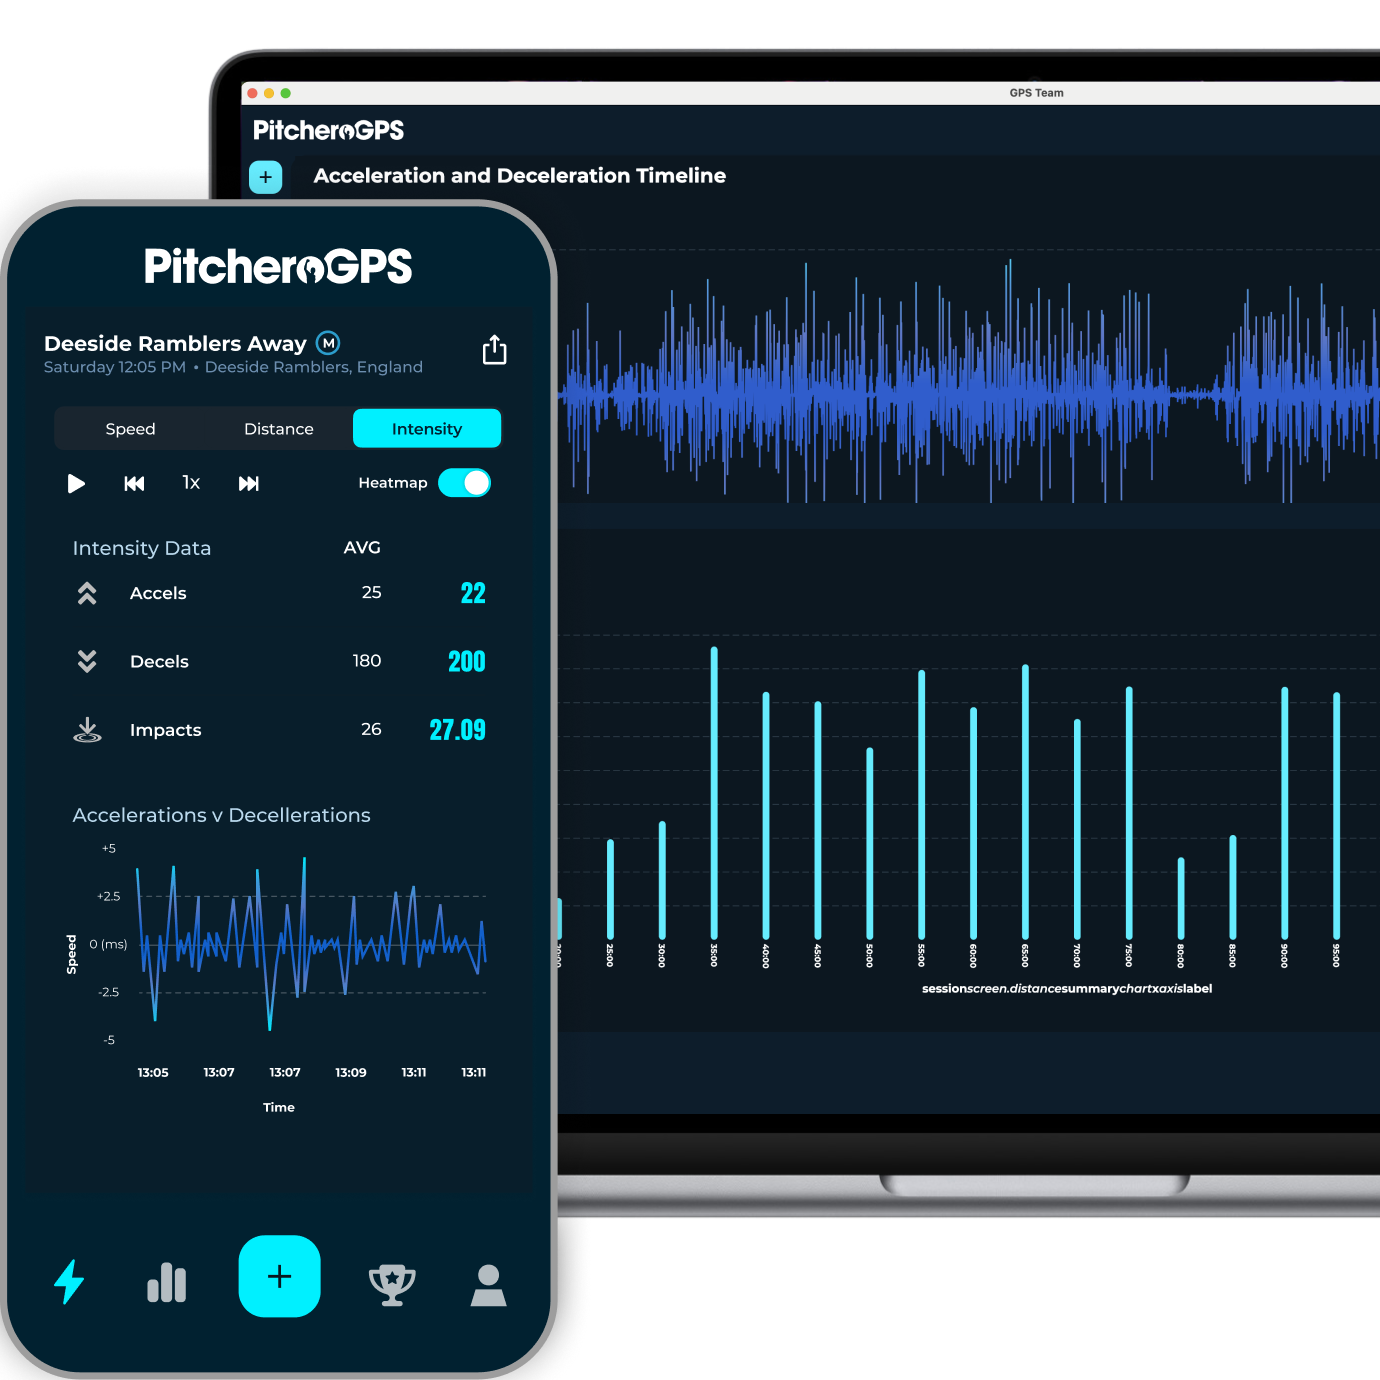
- Measure how often you rapidly speed up and slow down.
- Track explosive movements throughout each session.
- Customise acceleration and deceleration thresholds.
- Compare intensity between training and matches.
- See how movement demands change between players and sessions.
Load
See What Happens When Sessions Add Up.
One session tells you what happened today. Cumulative Load brings training and match data together so you can understand how workload changes across days and weeks.
Cumulative Load

- Bring multiple training sessions and matches into one workload view.
- See whether workload is increasing, decreasing or remaining consistent.
- Compare recent workload with longer-term patterns.
- Available in both the Player App and Team App.
Workload Trends

- Go beyond individual sessions.
- Track workload across time to understand how training and match demands change throughout the season.