PitcheroGPS Team Bundle for Rugby

Win. More. Games

GPS Trackers

For Rugby

VIEW PRICING

Rated Excellent on TrustPilot

Approved by World Rugby
VIEW PRICING

Rated Excellent on TrustPilot

Approved by World Rugby

Step into the future and revolutionise your team training and match day performances with the world-leading GPS Player Tracker and Analysis Software approved by World Rugby.

Step into the future and revolutionise your team training and match day performances with the world-leading GPS Player Tracker and Analysis Software approved by World Rugby.

1. RECORD

Record your player's Speed, Distance and intensity every training session and every match.

2. COMPARE

Compare player data using our initiative team analysis software.

3. IMPROVE

Train smarter, optimise every training session and track your players as they improve match by match.

International Pricing

PitcheroGPS Player Tracker PitcheroGPS Player Tracker

GLOBALLY APPROVED

World Rugby Approved

From grassroots to international rugby, the PitcheroGPS Tracker is approved by World Rugby for all levels of the game. 

Each tracker includes a crystal clear 1.4" screen, a 5 hour battery life and the latest GPS technology making PitcheroGPS Trackers the market-leading GPS player tracker in world sport. 

Innovative Hardware

The PitcheroGPS Team Bundle includes everything a team needs in one solution. 20x World Rugby approved GPS player trackers, 20x player vests, 1x charging case and unlimited access to the Team App for complete team and player analysis.

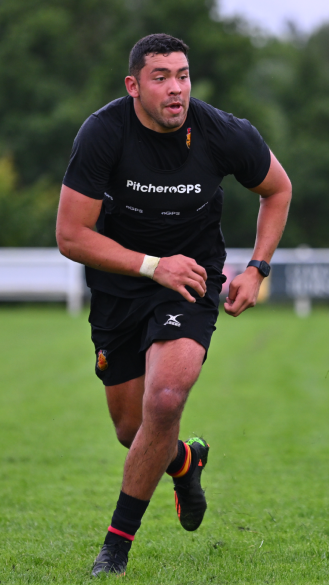
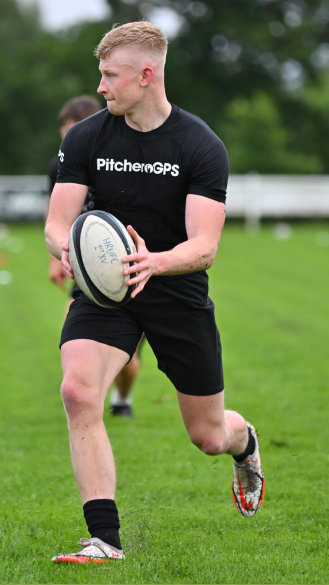
GPS Tracker & Player Vest

Made in Britain and built using the latest ublox SAM10 GPS chip, the PitcheroGPS tracker is the most up-to-date player tracker on the market.

Crystal clear 1.14' LCD screen displays shirt number and player initials.

The PitcheroGPS player vest is comfortable and robust enough to withstand the roughest impacts. Each vest is manufactured using the latest heat-seal technology.

Charging & Data Transfer

Lightweight and strong, the charging case stores up to 30 GPS trackers, and provides lightning-fast charging and data transfer.

Connect to a computer and transfer data from 20 trackers simultaneously in 5 minutes.

No waiting; session data will be processed in the cloud and available to view online in minutes on the PitcheroGPS Web App.

Intuitive Player Analysis Software

The PitcheroGPS Team Bundle includes unlimited coach access to the PitcheroGPS Team App software. The software is provided via a dedicated website which coaches can access 24/7 via laptops or tablets. Add unlimited coaches, no additional licenses; all analysis and data processing is included in the annual subscription.

Team Overview

Every data transfer creates a new session. The Session Overview summarises all player activity illustrating the total team workload. Summary metrics provide a benchmark for identifying players above or below the team average.

Coaches can navigate between multiple sessions on the same day or merge sessions.

Create custom speed zones and create data exports with a detailed breakdown of each player.

Player Split

Every session includes a player table detailing core metrics; top speed, total distance, speed zone distances, accels/decels and impacts.

Selecting a specific player opens the splits dashboard - providing a deeper dive into the individual's performance.

Create splits to highlight specific periods of play or exclude periods the coach does not want to include in the session.

Heatmaps

Available in graphic or satellite view, heatmaps display a player's entire session or specific team split. Additional data can be overlaid, including, Activity path, High-speed-running events, impacts and Accels and decels.

Heatmaps are a great way to analyse a players' positional awareness during a game, whether they were in the correct areas, tracking back enough to defend, or pushing forward to support an attack.

Distance Charts

Graphs provide a breakdown of the distance players cover during a session, illustrating peak periods of activity.

When were they covering the most distance (high levels of effort, intense, hard work) versus when were they covering less distance (low effort).

International Pricing

By providing us with more information about your team, we can give you accurate pricing based on your country and the number required.

Impact Timeline

Graphs show the number of impacts above a defined G-force threshold. The threshold can be adjusted to consider factors such as sport, age and session type.

Useful for monitoring athletes' well-being - large volumes of high G-force impacts within a single session may suggest the player needs more rest.

Accel/Decel Timeline

Graphs show a player's levels of acceleration and deceleration during a session. Coaches can set custom thresholds suitable for their sport and standard. 

Accels and decels are high-intensity explosive movements that require significant energy to perform. Multiple events within a single session can suggest high levels of effort from the player, but also an increased physical strain on the body - more rest and recovery are needed. 

If players are not hitting these thresholds, they may need to work on specific exercises to improve their explosive power and change of pace.

Player Comparisons

Coaches can compare players within a session using player split. This function displays all metric charts with values for each selected player in the comparison.

Historical Charts

Create metrics for multiple sessions over the season. Coaches can view data for the team or individual players to review their performance.

Charts include; Total distance, HSR distance, HSR count, Accels, Decels, and Impacts. 

Charts can be customised to show all sessions or just training or matches. Units of measurement are also editable. Summary data is provided to show the Total, Average, and Best values within the chosen time period.