
The Metrics
SPEED
Know how fast your really are.
Track your maximum speed, high-speed running and time spent in different speed zones. Compare training with match performance and see how your speed changes over time.
Max Speed
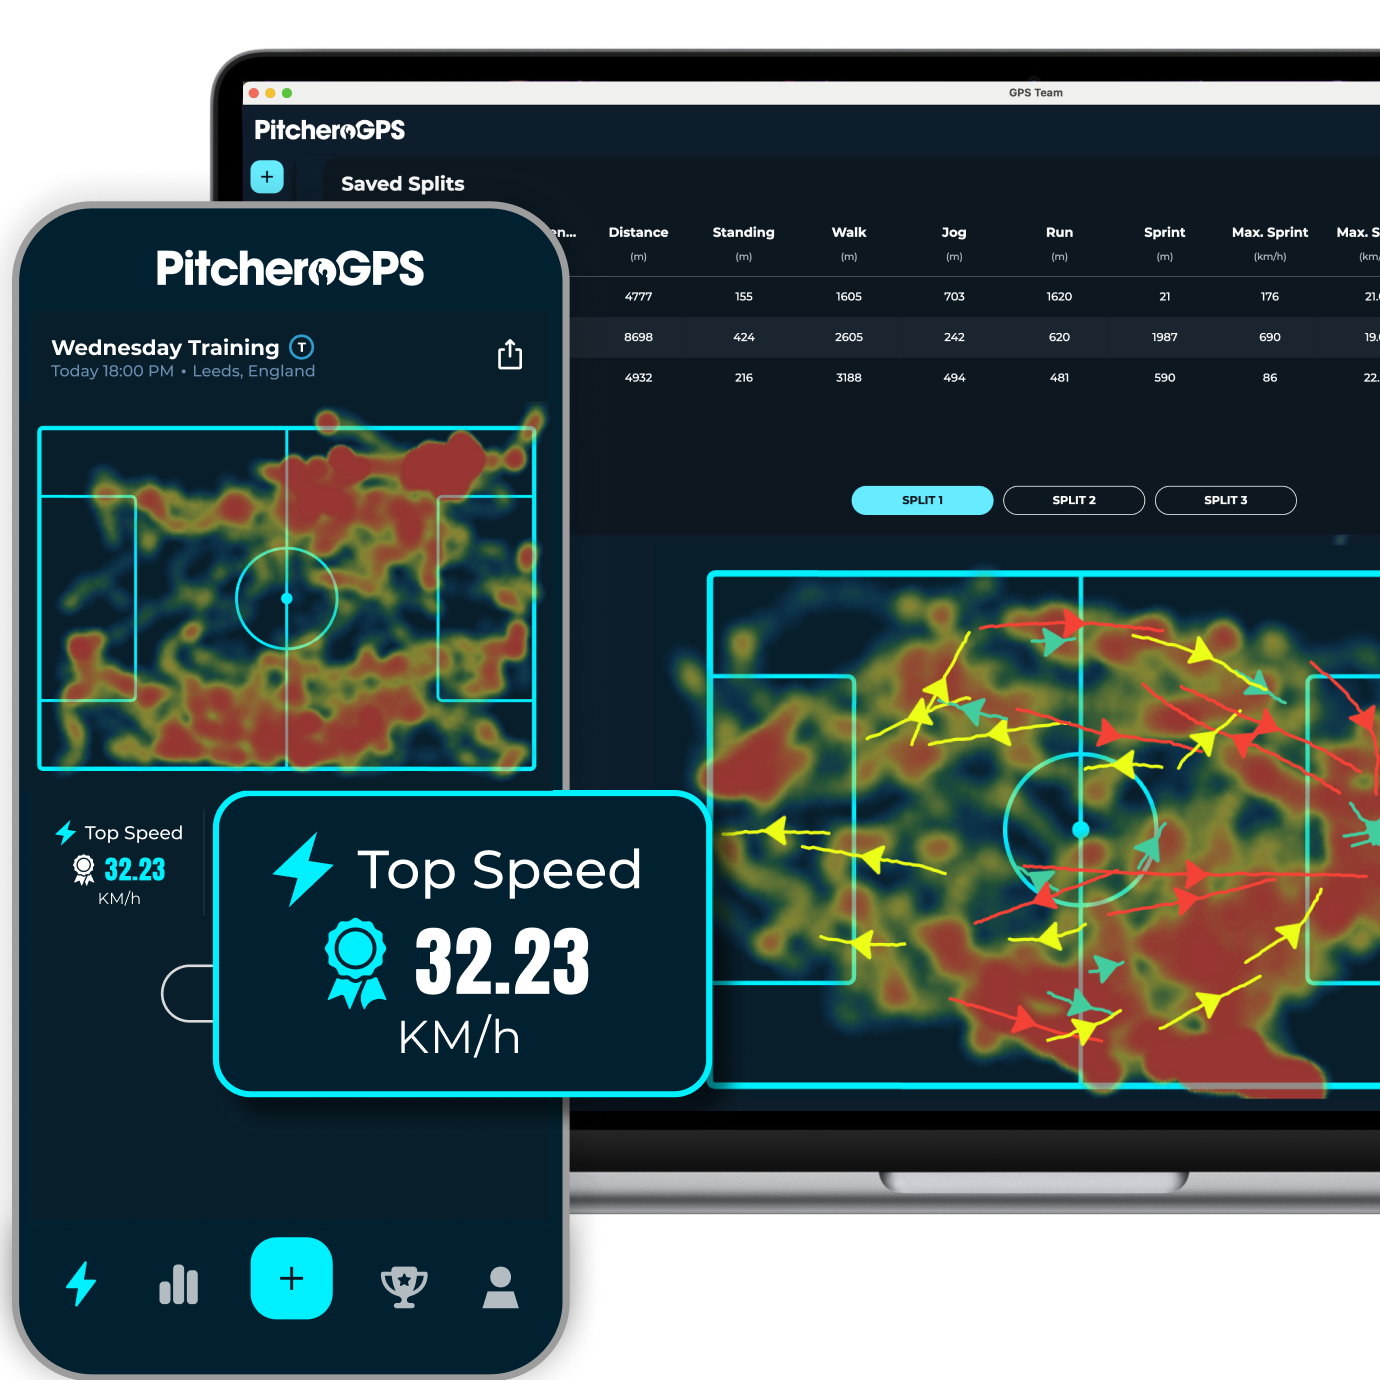
- See the fastest speed you reach during every training session and match.
- PitcheroGPS records your maximum sustained speed.
- Compare Max Speed between sessions and matches.
- Track personal bests and see how your speed develops over time.
High-Speed Runs (HSR)
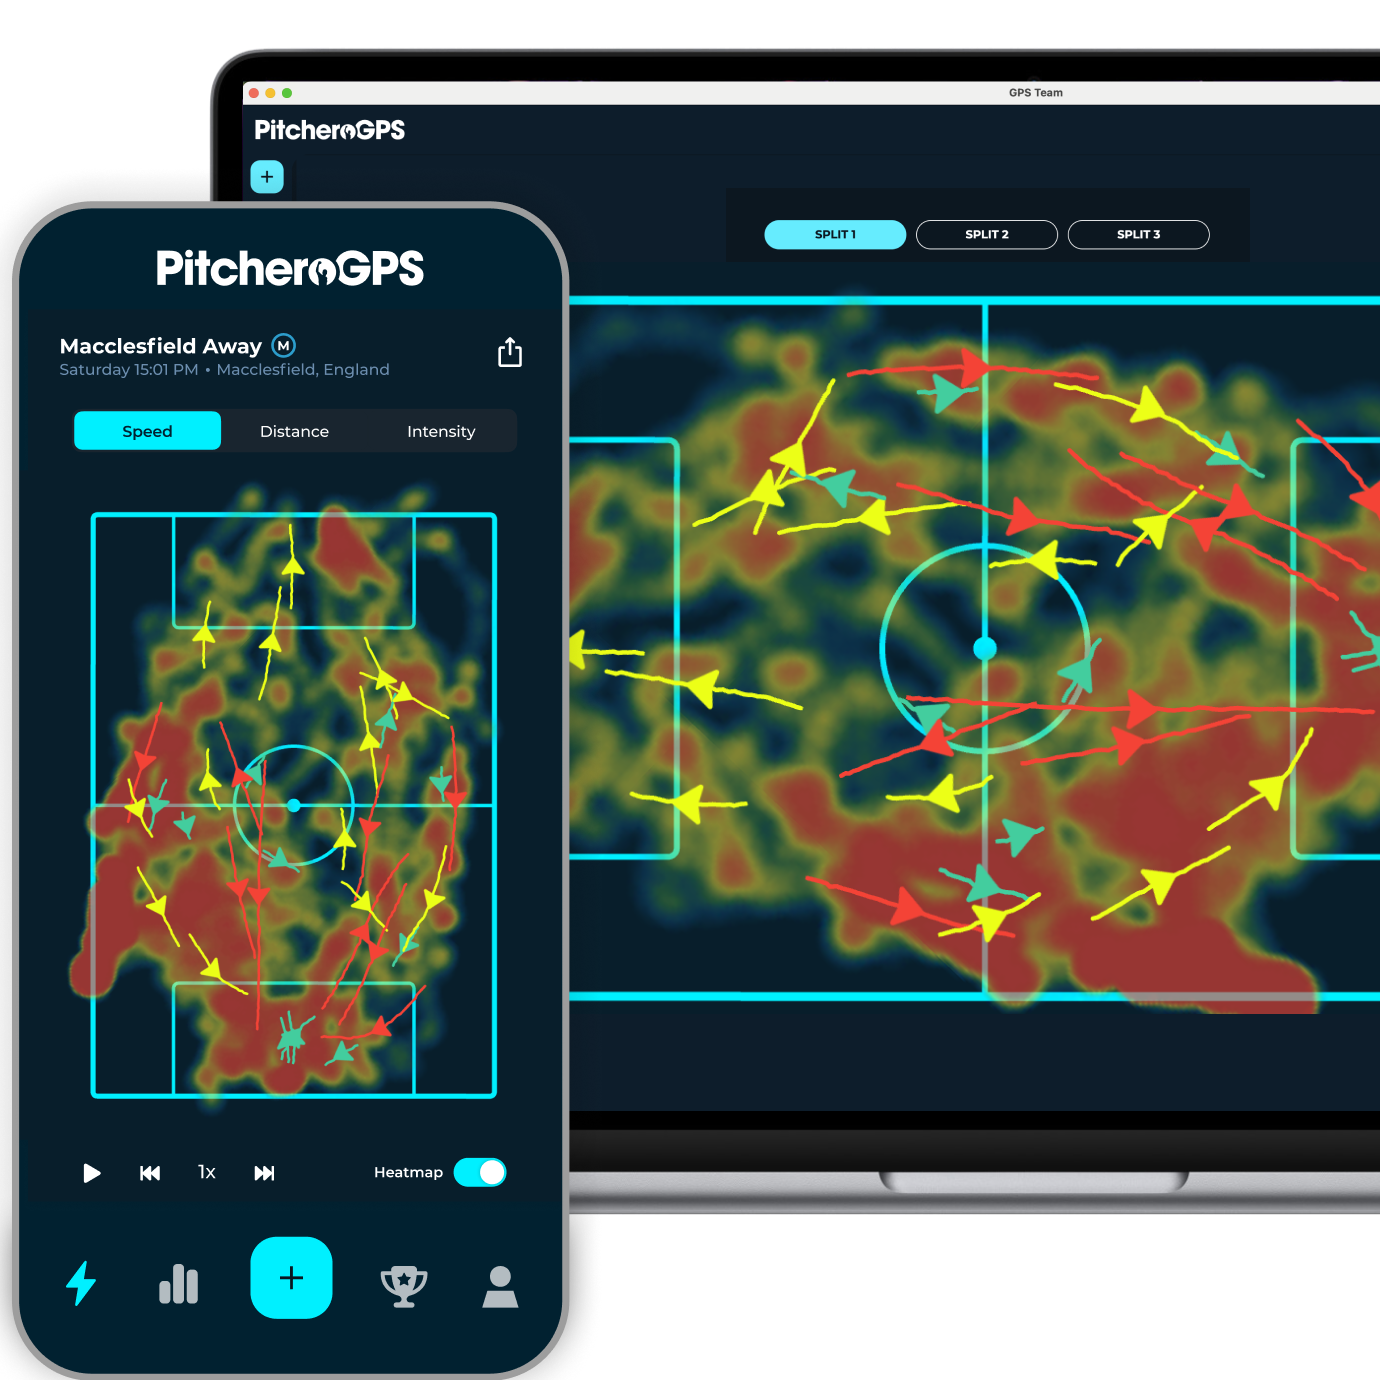
- See how often you perform at high speed — and how much distance you cover there.
- Track the number of high-speed runs in every session.
- Measure total distance covered above your chosen speed threshold.
- Customise the threshold to suit your sport, level or individual performance.
- Compare high-speed output between training and matches.
Speed Zones
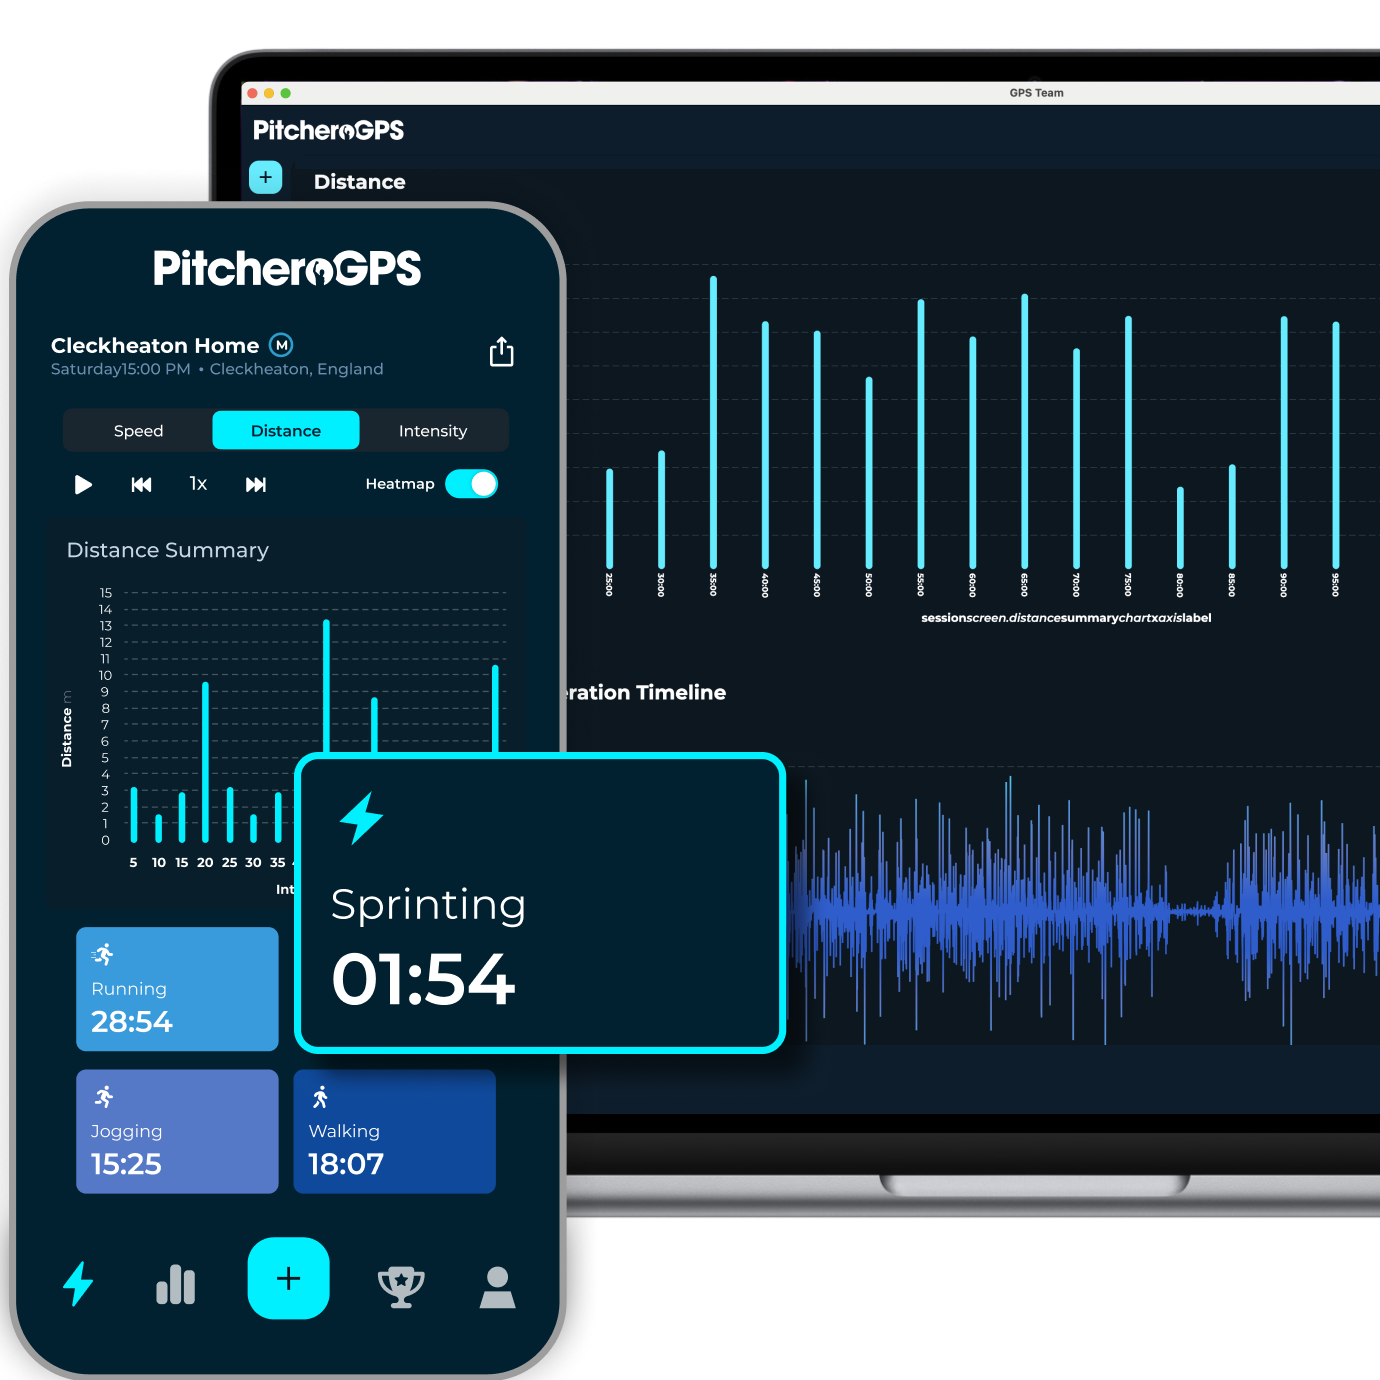
- PitcheroGPS categorises a player's session into different speed zones.
- Default speed zones include walking, jogging, running, and sprinting, and these can be customized.
- More time spent in higher speed zones indicates greater effort and intensity.
- Coaches should encourage players to spend more time in higher speed zones to improve aerobic fitness and increase their on-field impact.
- Analysis of speed zone data helps coaches ensure players maintain high activity levels and train at match-realistic intensities.
Distance
Understand your total workload.
See how much ground you cover and how your work rate changes throughout a session. Distance metrics help turn an overall session into something you can measure and compare.
Total Distance
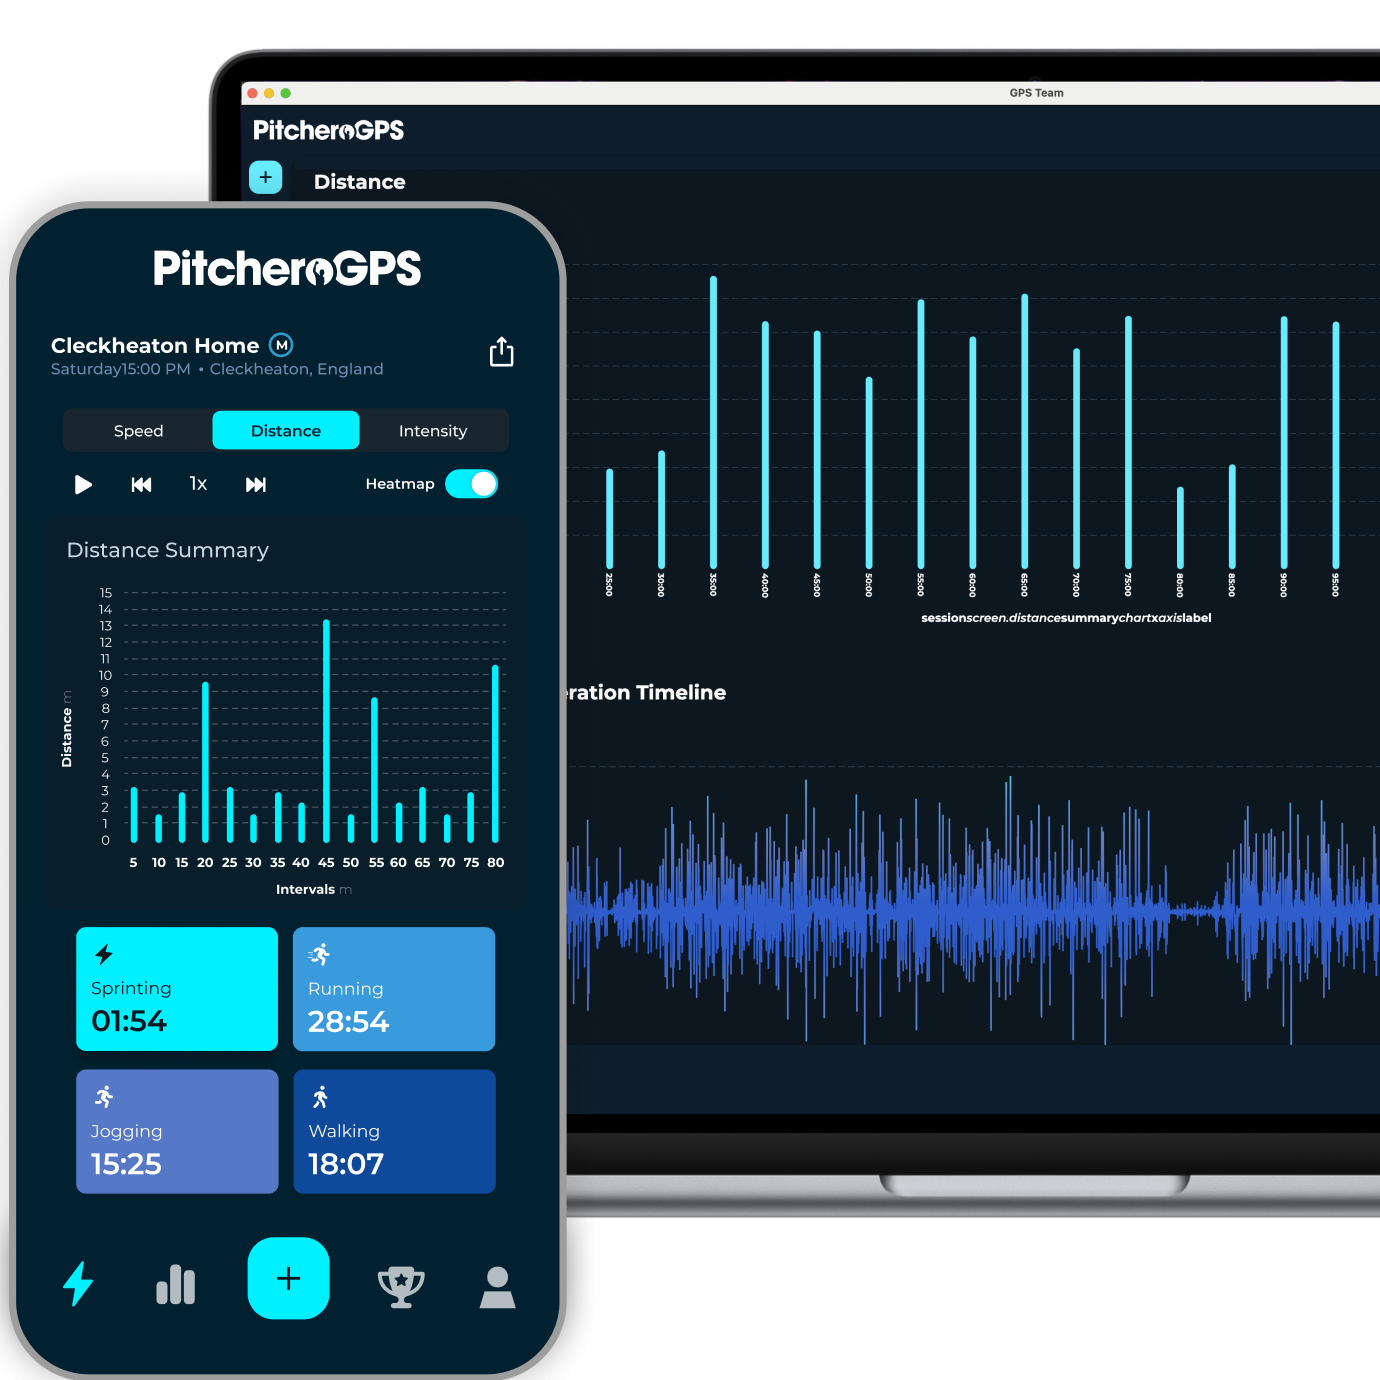
- PitcheroGPS records the total distance a player covers during a session, allowing easy assessment of their contribution relative to the team's overall effort.
- Professional football players typically cover between 9 km and 11 km per game, varying slightly by position.
Work Rate — Metres Per Minute
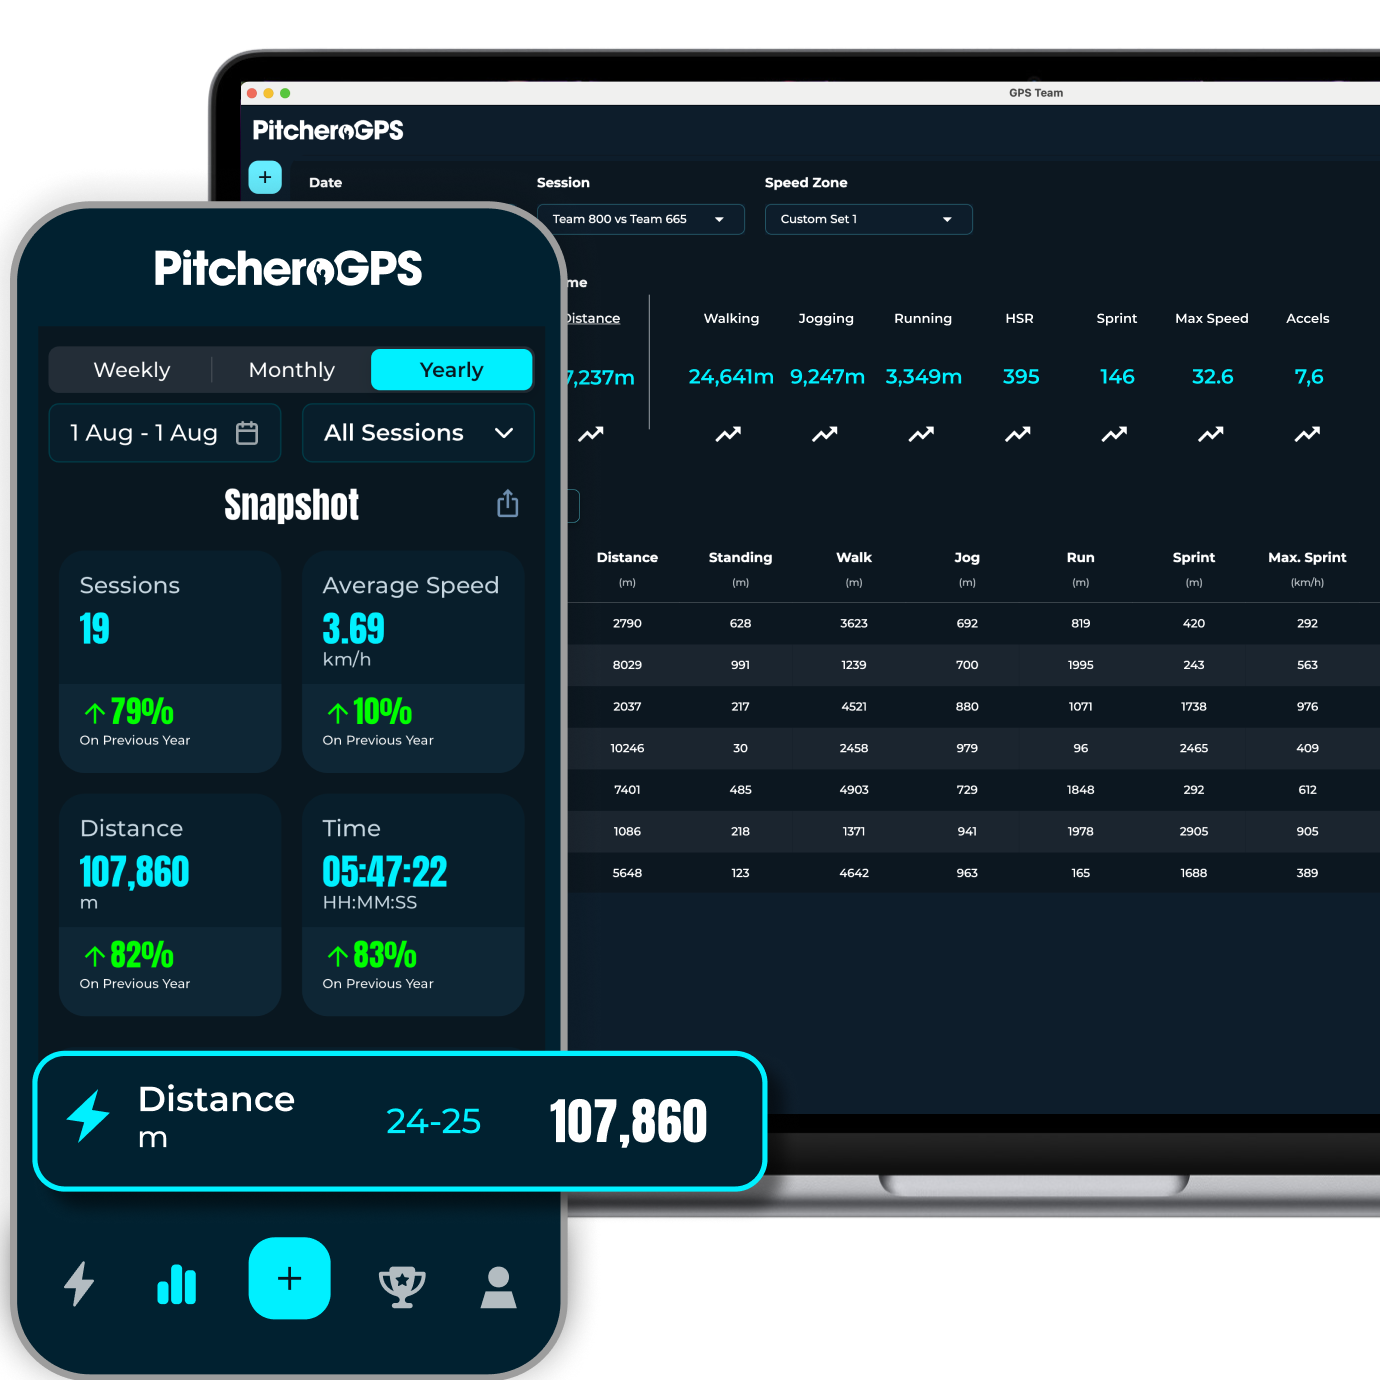
- PitcheroGPS tracks metres per minute (m/min), providing a snapshot of a player's intensity during a session.
- Metres per minute (m/min) is calculated as the average metres run divided by session duration in minutes.
- Professional athletes typically average over 100 m/min in games.
- This average helps players and coaches monitor effort and work rate, irrespective of session length or time on the field.
- Interval charts can highlight when fatigue begins, indicated by decreasing m/min values, helping coaches plan substitutions and targeted fitness training to sustain peak performance throughout games.
Intensity
Measure the Explosive Parts of Performance.
Football, rugby and hockey aren't played at one constant speed. PitcheroGPS captures accelerations and decelerations to show the high-intensity movements behind your overall distance.
Accelerations/Decelerations
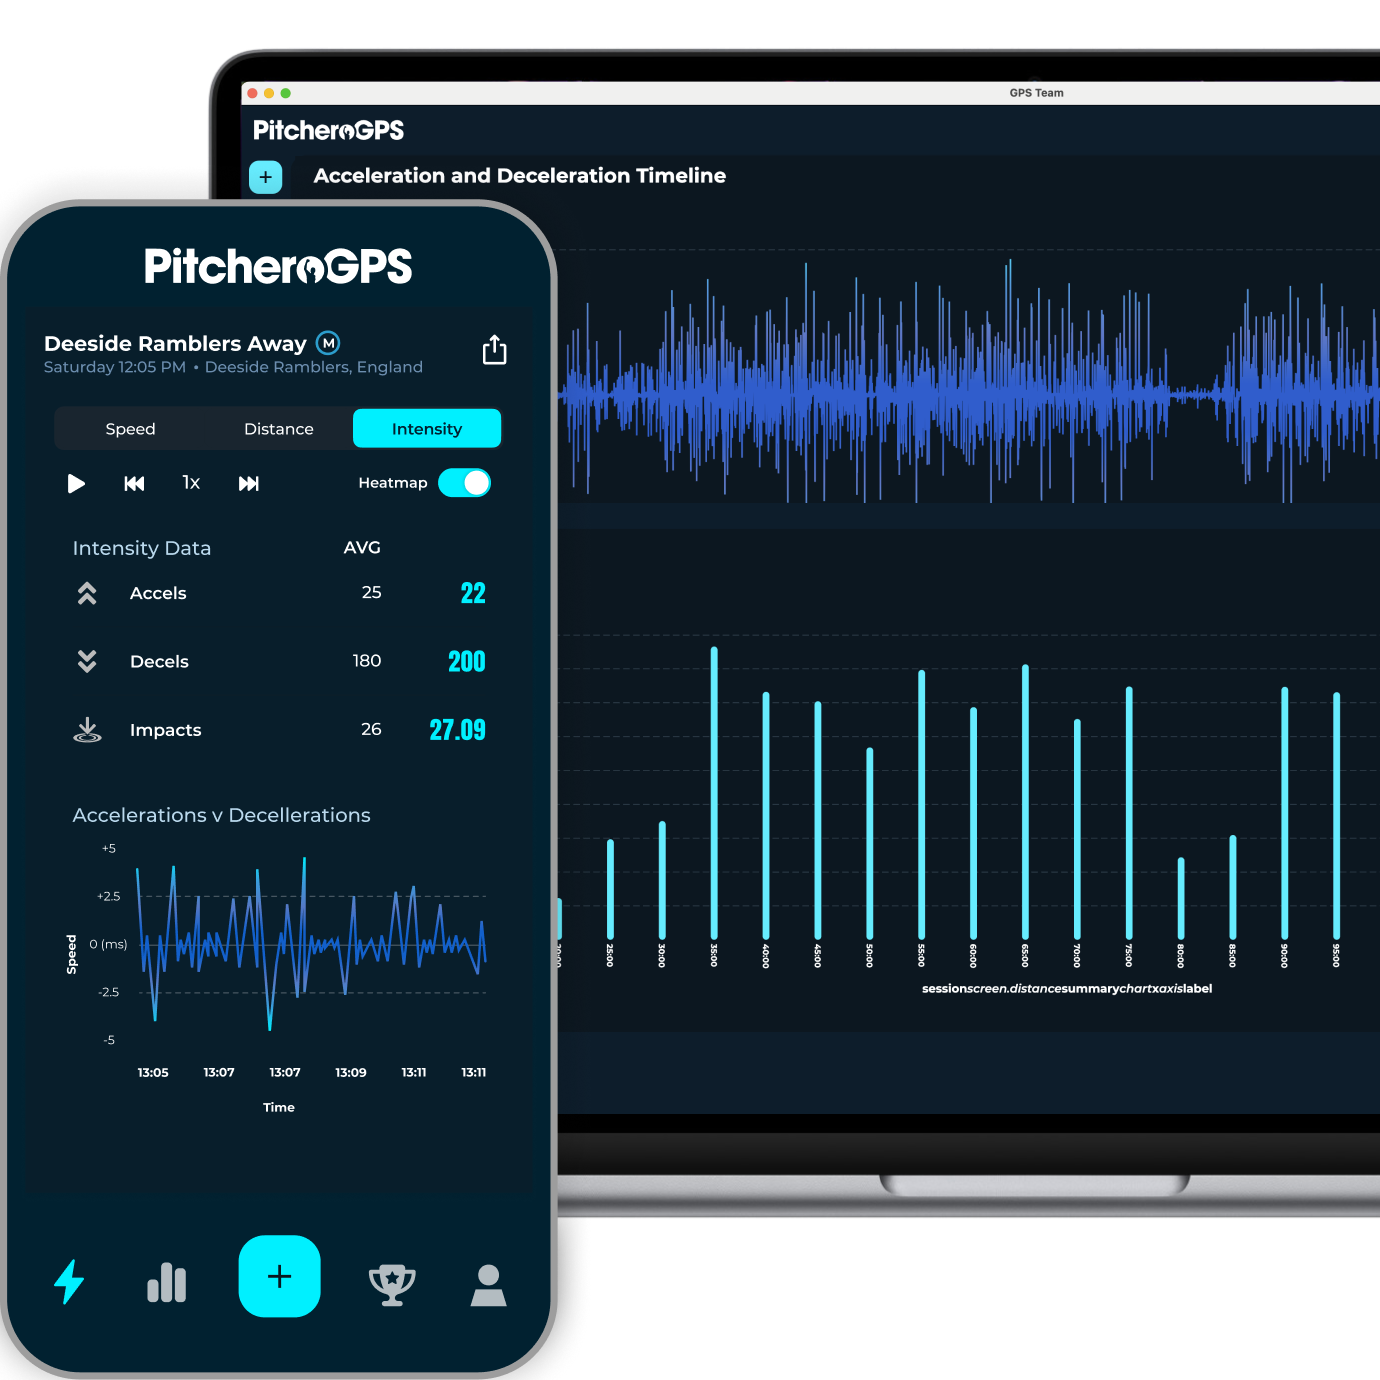
- PitcheroGPS records accelerations and decelerations, which are high-intensity explosive movements demanding significant energy.
- Acceleration and deceleration thresholds can be customized by players or coaches.
- Frequent accelerations and decelerations within a session typically indicate high player effort and physical stress.
- If players consistently miss these thresholds, targeted exercises can help improve explosive power and agility.
- Accels and decels are vital for outpacing opponents or quickly changing direction in both attacking and defensive 1v1 situations.